What Should A Blood Sugar Graph Look Like?
Our blood sugar controls how we feel at every second of every day and also has huge impacts on our long-term health.
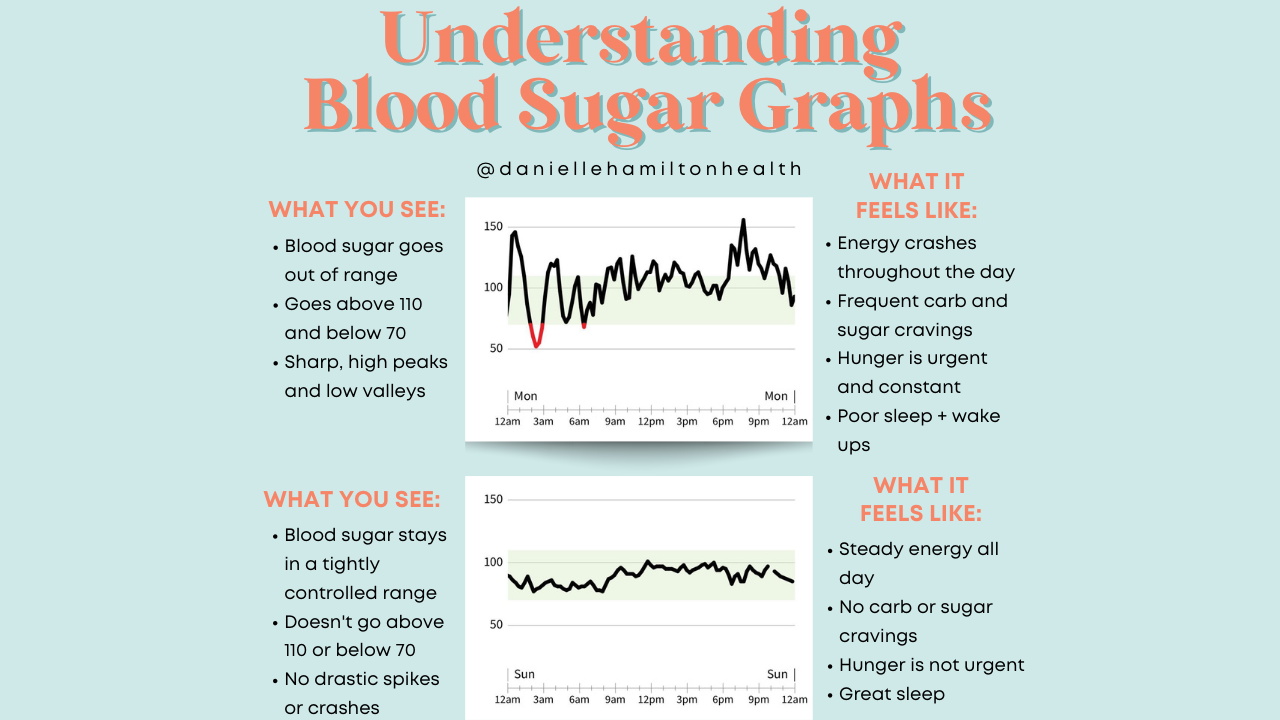
But you already knew that 😉 So now I want to teach you all how to better understand your Continuous Glucose Monitor (CGM) graphs.
When your graph has lots of spikes and crashes and goes out of that happy green range, you start to feel lots of unwanted symptoms (like cravings, dizziness, shakiness, urgent hunger, fatigue, anxiety, & more) and this is what contributes to long term health issues (like high cholesterol & blood pressure, hormone imbalances, diabetes, etc.)
But when your graph stays in that happy green range (which I recommend setting at 70-110 mg/dL /3.9-6.1 mmoL… more on this in future posts), you feel stable energy, have better moods, sleep soundly, don’t have cravings or intense hunger and you set yourself up for better overall health and well-being!
Over time, after you heal, you can get more leniency with your green range. I now put mine up to 120 mg/dL bu...
